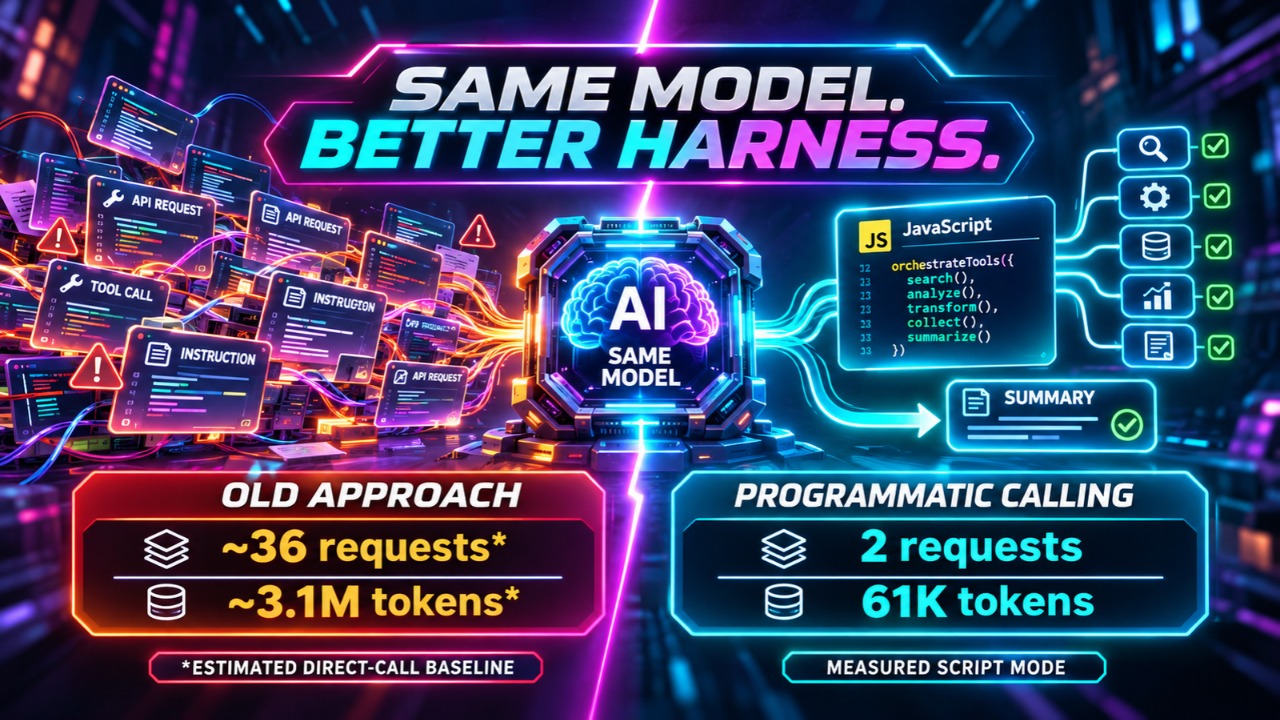
Same task. Same model. Same tools. Factory's own model puts the direct-call side at 36 model requests and about 3.1 million input tokens to move 151 Linear issues between queues and verify every move. The rebuilt harness did it in two requests and about 61,000 tokens.
That is not a model upgrade. Factory shipped Droid 1.0 on October 29 and stopped letting the model call tools one at a time. The model now writes a JavaScript program, the program runs in a sandbox with no file, network, or system access of its own, and only printed output comes back to the model. One model request can drive hundreds of tool calls.
Two definitions, because these words get used loosely. Tool calling is the model asking your harness to run a function, read a file or hit an API, and hand back the result. Programmatic tool calling means the model writes a program that calls those functions itself, loops over what comes back, and prints only what matters.
Your harness is paying per byte for raw tool output the model never needed. That is the entire argument.
The thesis, stated plainly: your harness decides pass rate and cost more than your model does. If your team is standardizing on a model this quarter, you are optimizing the wrong variable.
THE NUMBERS: WHAT CHANGED AND WHAT IT COST
Factory cut the first request of a session from 20,887 input tokens to 13,055, a 37% reduction. Tool definitions went from 11 sent up front to 2, falling from 15,798 tokens to 8,528. Rarely used tools now load on demand.
The launch coverage skipped the other half. The system prompt grew 33%, from 1,618 tokens to 2,155, because Factory added new guidance on how the agent talks to a user and how it handles images, connected apps, and personal data. The 37% cut is a net figure, not a trend that runs through every component.
Then the headline task. The Linear cleanup moved 151 approved issues to a backlog and verified that only the status changed, 312 tool calls in all. The script took 2 requests and about 61,000 input tokens. Request one wrote the program. Request two read the six lines it printed.
Factory models the direct-call side rather than measuring it, and its methodology says so. Assume 3 to 10 calls per request and about 28,000 tokens of instructions re-sent every time: 36 requests and about 3.1 million input tokens at the fast end, 107 requests at the slow end. The 2 requests and the 61,000 tokens are real. The 36 and the 3.1 million are an estimate, and any vendor making this argument is making it against a version of your harness you have not shown them.
The CI sweep measures what the model reads. One script checked 5,384 desktop jobs across 547 runs, 550 tool calls, 60 at a time, in 2 requests instead of an estimated 59 to 187. The model saw a five-number summary that included 41 failed jobs. Under 0.1% of the tool results reached its context, and the sweep ran in the background for about eight minutes while the model worked on something else.
On Terminal-Bench 4, all tasks, three trials per task, run October 23 to 28: with Claude Opus 5.5, Droid scored 65.2% against Claude Code's 57.6%, at up to 24% lower cost. With GPT-6.1 Sol it scored 57.6% against Codex's 54.0% at 12% lower cost, while taking 10% longer per passed task. That number belongs in the paragraph. The architecture wins on cost and loses on wall clock against a native harness tuned to its own model.
Script mode alone cuts Droid's cost 15% versus direct tool calling on Opus 5.5.
WHY IT WORKS: THE CONTEXT WINDOW IS A TOLL ROAD
The model does not need the raw bytes of tool output. It needs the conclusion of a computation over them.
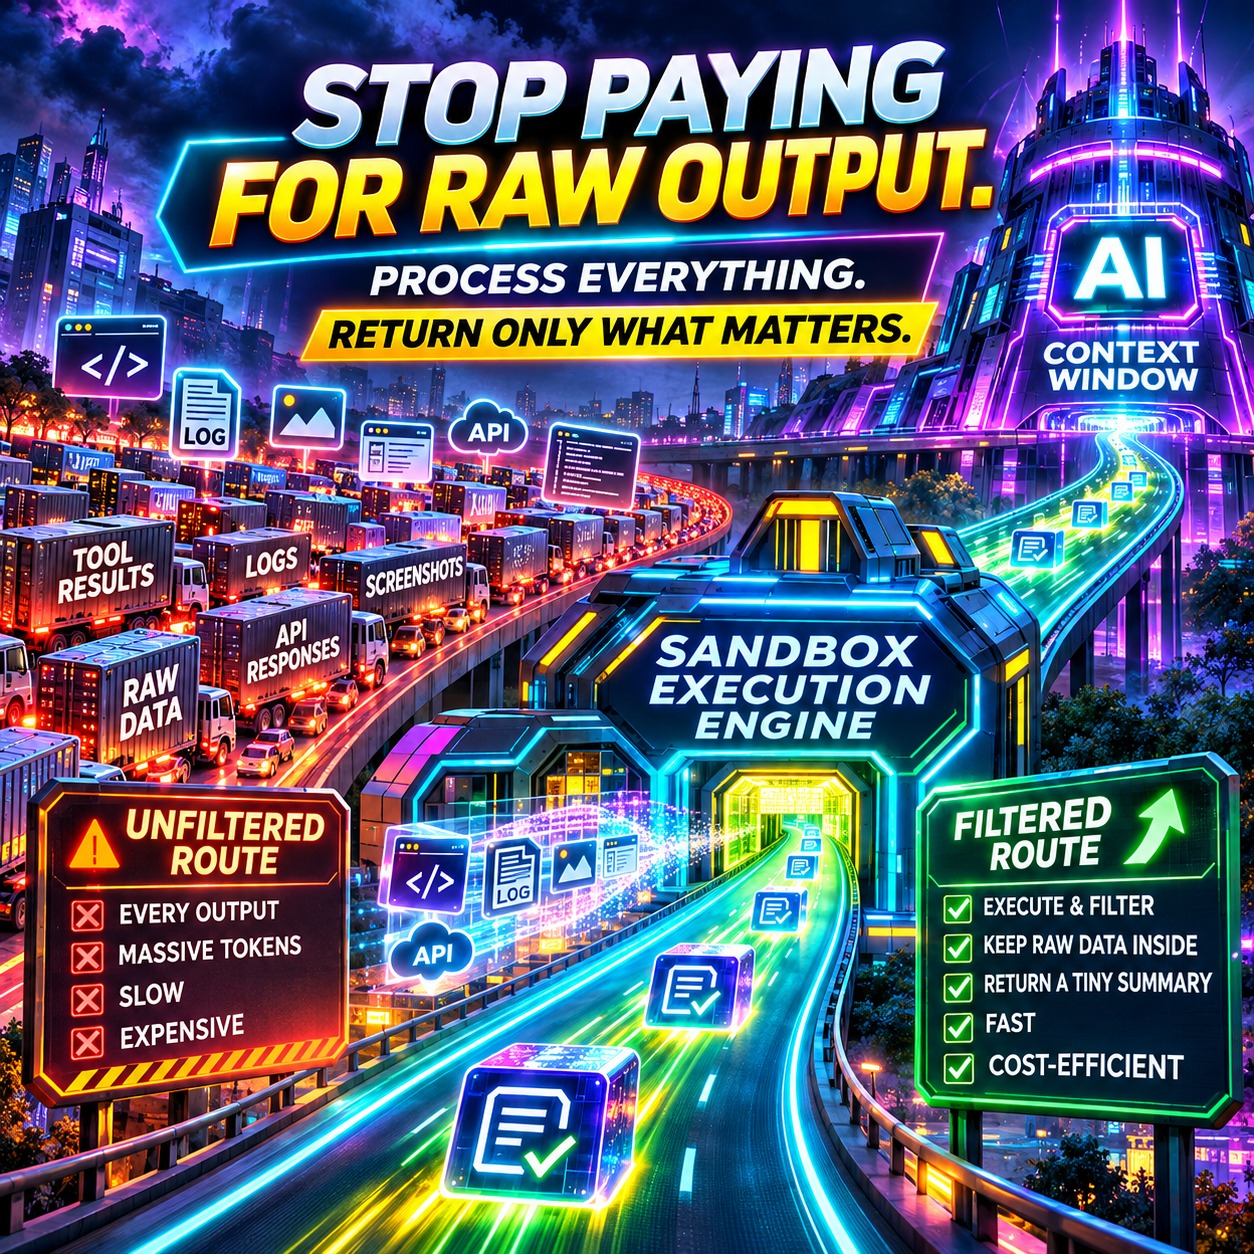
Context Mode states the problem from the other end. A single Playwright snapshot costs 56 KB. Twenty GitHub issues cost 59 KB. One access log costs 45 KB. After 30 minutes, 40% of a context window is gone. Its own tool table turns 56 KB into 299 bytes and 45 KB into 155 bytes.
A program in a sandbox is a lossy filter, and the loss is the product. Printed output is the only thing that pays the context toll. Raw files, search results, and logs stay inside the program as variables, where they cost nothing and cannot distract the model on the next turn.
This is the argument in "Your Cost Curve Just Broke. Harness Efficiency Now Decides Your AI Bill," one level down. A harness that re-sends instructions and growing history on every call does not pay for that mistake once. It pays on every turn after it.
The second gain is the one worth keeping. Loops run deterministically in code. Factory's Linear script compared 15 fields before and after every write, kept exact counts, and was written to stop at the first issue that changed in any other way. A model can decide to skip a case it planned. A for loop cannot.
THE FAILURE MODES: WHAT A SANDBOX CANNOT DO
- A sandbox that can touch nothing can prove nothing. The cleanup verified 151 issues because the script could read each issue back and diff 15 fields. Verification needs read access at a minimum. A sandbox with no file and no network access of its own cannot be your only checker, or you will get a program that reports success and a queue that disagrees. Factory's seam is worth copying: full results are logged where the model can search them later, so the printed summary points into a record that still exists.
- Printed output is a lossy interface. Print too little and the model is blind. Print too much and you rebuilt the firehose with extra steps, paying for a sandbox and a context bill. Factory caps printed output and leans on a five-number summary for a 550-call sweep. Your cap should be a number in your config, not a habit.
- A model-written program is a model-written bug. The failure surface does not vanish, it moves into the middleware. You are now debugging generated JavaScript, which fails in ways a bad tool call never did.
- This decides whether you should adopt any of it. Programmatic tool calling pays only when a task makes many calls. Factory's own numbers, published against its own interest: savings concentrate in the 12.5% of tasks that make six or more tool calls. Below that line the sandbox is overhead with a new failure mode attached, so a one-call-per-turn workflow should keep direct tool calling. Six calls is the threshold to test, not a rule to copy. Stronger models plan further ahead and write scripts that do more per request.
THE ONE METRIC TO INSTRUMENT
Here is the number to put on a dashboard, and to quote back at any vendor selling a window rather than a filter: the tool-byte ratio, the share of tool output bytes that enter the context window.
Count bytes, not tokens, because bytes are what your harness measures before a provider sees them. Total tool output goes in the denominator. Bytes that reach the model go in the numerator. Everything you print, log, and summarize sits in between, and that gap is your engineering.
Two published readings sit on the same axis. Factory's CI sweep held the ratio under 0.1%, because 550 calls collapsed into a five-number summary. Context Mode's aggregate claim is 315 KB in and 5.4 KB out, a 98% reduction.
The decision rule follows directly. If your tool-byte ratio is in double digits, your harness is your cost problem, not your model. Measure it before you rewrite anything.
WHAT TO DO TODAY
- Add the counter first. Bytes of tool output produced, bytes that reached the model, one log line per turn. You need one number before you have an opinion about architecture.
- Pick one workflow where the model makes many small sequential calls. Rewrite that workflow so the model writes one script and prints a summary. One workflow, not a rewrite of the harness.
- Compare requests, tokens, and pass rate on the same task. Pass rate goes first, because a cheap harness that fails more often is not cheaper, it is cheaper per attempt.
- Check your base prompt size. If it is five figures, ask what the model actually uses from it. Factory cut tool definitions 46% while its system prompt grew 33%, which tells you where the fat usually is and where careful teams keep spending. The component price list in Your Harness Is Paying for Planning It Does Not Need is the budget line for that trade.
- Read Anthropic's consolidation guidance next, which attacks the same bill from the other side. Keep the distinction straight. Factory changes how tools are called, replacing a dozen round trips with one program. Anthropic changes how agents are structured, folding specialized subagents into a single primary agent that loads context on demand. Both cut the same context toll: one cuts the bytes that pay it per call, the other cuts how many separate contexts pay it at all. Anthropic published a single agent loop kit so teams can test the switch, and reports one comparison where the single agent ran about twice as fast, plus one failure, where folding a subagent cut latency and broke a process that had been passing. Note its threshold for tool sprawl too: tool selection degrades beyond 30 to 50 definitions.
THE UNCOMFORTABLE QUESTION
Your last agent rewrite. Did it change the model, or did it change how many bytes you were paying for?
Same weights, 98% less context traffic, and the harness is the only variable there you own. The model is rented from somebody else and it changes under you every few weeks.
If you cannot name your tool-byte ratio, you are not engineering your harness. You are renting it.
Get More Articles Like This
Getting your AI agent setup right is just the start. I'm documenting every mistake, fix, and lesson learned as I build PhantomByte.
Subscribe to receive updates when we publish new content. No spam, just real lessons from the trenches.
Build Real AI Infrastructure
PhantomByte teaches you to build real AI infrastructure yourself: local AI stacks, autonomous agents, multi-agent orchestration, web scraping, and custom tools. Step-by-step PDF tutorials you download, follow, and deploy. No subscriptions. No fluff. Just skills that ship.