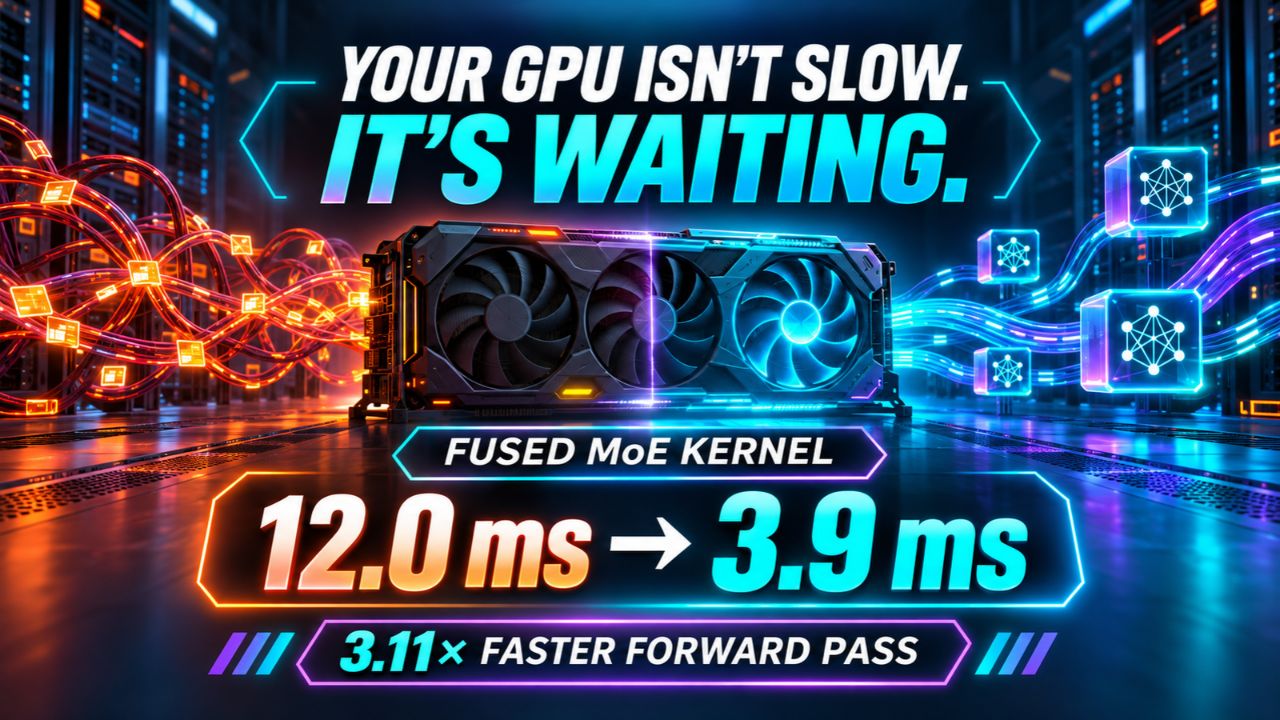
Prime Intellect published a fused MoE kernel that takes a single mixture-of-experts layer's forward pass from 12.0 milliseconds down to 3.9. That is 3.11x on Qwen3-30B-A3B. Divide those two rounded numbers and you get 3.08x, and the gap is unrounded step means inside Prime Intellect's own averaging, so read 3.11x as the vendor's measurement rather than arithmetic you can rebuild from the printed pair. In their prime-rl trainer, full training steps ran 32 to 34 percent faster than their own baseline and 48 to 55 percent faster than TorchTitan, measured on 8x H200 nodes, FP8, 16,384-token sequences, with full activation checkpointing.
Here is the part that should sting. The kernel did not make the GPU faster. There is no new chip, no new math, no smaller model. It stopped the GPU from waiting.
The wait is the transport layer. In a standard MoE layer the GPU sorts tokens, hands them to the transport layer, waits, computes, hands the results back, and waits again. That happens twice per layer on every training step, once in the forward pass and once in the backward pass. Every one of those waits is idle time you already paid for. The cheapest capacity you can add this quarter is the idle time you already own.
WHAT A MIXTURE-OF-EXPERTS LAYER ACTUALLY DOES
A mixture-of-experts model holds many small sub-networks called experts and routes each token to a few of them, so a 30B-parameter model can activate roughly 3B parameters per token. That is why the 30B model in these benchmarks carries the name A3B. Expert parallelism puts those experts on different GPUs, which means tokens have to travel across the network to reach the expert that owns them, and results have to travel back. A fused kernel is one GPU call that does the dispatch, both expert linear layers, SwiGLU, and the combine, instead of four separate calls separated by network round trips.
The fusion is not the trick. The overlap is. While one group of tokens is in transit, the kernel computes on a group that has already arrived. DeepSeek's Mega MoE in DeepGEMM shipped that idea for the forward pass only. Prime Intellect wrote the missing backward kernel, also overlapping, which is what makes this a training result and not an inference result.
WHY THE SPEEDUP IS 3.11x FORWARD AND 1.24x BACKWARD
Same kernel, different model, different answer. On Qwen3-235B-A22B the forward pass went from 20.7 to 9.5 milliseconds, a 2.17x gain, and the backward pass went from 30.5 to 24.6, only 1.24x. On Qwen3-30B-A3B the backward pass still moved at 1.87x, 15.4 down to 8.2. Measure the whole layer and you get 2.47x on the 30B and 1.64x on the 235B, because the layer costs two forwards plus one backward.
The reason is the compute-to-communication ratio. Overlap pays where the GPU has enough math to do while tokens are in flight. On the 235B backward, there is more gradient traffic to move and comparatively less arithmetic to hide it behind, so the network stops being free. My reading of the numbers, and this is analysis rather than anything Prime Intellect states, is that the backward pass on a large MoE is where your all-to-all and your weight-gradient reduction both land, and only one of them hides well.
The decision rule is the useful part. Overlap is not a constant you buy once. It is a function of your model's shape, your expert count, your sequence length, and how much of the step is already arithmetic. Measure the ratio before you promise anyone a speedup. A vendor's best case is that vendor's model, not yours.
THE SAME LESSON AT THE INFERENCE END
Microsoft Research and UC Berkeley's TokenEconomizer landed in the same news cycle, and it is the same physics at a different layer of the stack. It is an external controller that watches completed sessions in a repository and changes nothing about the model weights or the agent code. Before each new task it sets three policies: which one-line facts about the repo to inject, which tools to mask, and when to stop a failure loop. It is Apache 2.0 and works across Claude Code, Codex, and GitHub Copilot CLI, with the project also listing Pi.

The waste it found is worth naming. In a profile of 60 SWE-Bench tasks across six repositories, once five tasks preceded the current one, 30 percent of tool calls repeated an action the agent had already taken. Of 23 tool schemas loaded on every turn, 16 were never called and 3 covered 98 percent of calls. And 10 failed runs were 17 percent of tasks but 32 percent of total spend.
Across 277 SWE-Bench tasks it cut mean cost 18.4 to 30.9 percent across five agent and model settings, cheaper in all 30 repository and setting cells. Best case was 30.9 percent on Claude Code with Opus 4.8, rising to 33.2 percent combined with RTK. The honest limit matters more than the headline. On ReposVul security audits, savings fell to 6.4 to 9.3 percent, because shorter runs leave less to remove, and Pass@1 dropped 1.0 point on Opus 4.8 while rising in the other four settings. Removing waste is free until the waste is doing work. Measure what you cut.
THE NAMED FRAMEWORK: IDLE-FIRST CAPACITY
This is my framing, so file it as opinion even though every number under it is measured. Call it Idle-First Capacity. Before you buy another GPU, rank your stack by idle fraction, not by throughput. Training: the transport waits in the MoE dispatch chain, which is the thing this kernel exists to delete. Inference: context re-sent on every turn and repositories re-read on every task. Serving: the prefill and decode mismatch I wrote about in Your 128K Context Is 6x Slower Than It Needs to Be, where the same GPU sits at low utilization because the work arriving does not match the shape it is good at. Scheduling: the idle capacity I measured inside a single GPU in Your GPU Scheduler Is Leaving 33 Points of Utilization on the Table.
The agent-side version of the same tax is now published. A coordination tax paper measured a planner-coder-reviewer pipeline at 3.22x the cost of a single strong call and 3.24x the wall time, solving no more tasks, across 2,430 runs on 135 tasks. The protocol itself was cheap at 7.2 milliseconds per handoff, 0.11 percent of pipeline wall time. The structure was the cost, not the plumbing. People add architecture and assume it adds capability. Measure the idle fraction first. Buy capacity second.
HOW TO MEASURE IT ON YOUR OWN CLUSTER
Profile one training step and separate compute time from non-compute gaps at the MoE dispatch boundary. If the gap is a third of step time, you are the target audience for this kernel and you have been buying GPUs to cover a queue.
Run the published numbers as a baseline before you believe anything. One node, 8x H200, EP=8, 128 experts, top-8 routing, 16,384 tokens per GPU, FP8. That is the shape of the 12.0 to 3.9 millisecond delta, and it is self-reported by Prime Intellect, so it is a target to reproduce rather than a fact about your cluster.
On the inference side, run the TokenEconomizer method against your own repositories. Its open source release is the cheapest way to learn what your agent re-reads.
Watch the accuracy line alongside the cost line. Track Pass@1 or your own task success rate on every waste cut, and treat any saving that only shows up on the invoice as suspect until accuracy holds.
WHAT TO DO TODAY
- Profile one training step tonight. Split compute time from wait time. If waits are a third of the step, you found free capacity you already rent.
- Check whether your MoE path fuses dispatch, expert layers, and combine into one call, or hands off four times per layer. In prime-rl it is one config line,
type = "mega_moe"under the trainer's MoE dispatch section. - Point your inference stack at its own logs. An 18.4 to 30.9 percent saving on published settings means most agent sessions carry measurable waste.
- Write down the idle fraction per layer before the next capacity purchase. Buying GPUs to cover idle time is the most expensive way to wait.
- Re-run the accuracy check after every waste cut. The 6.4 percent audit case is your reminder that some waste is load-bearing.
None of this is exotic. It is measurement, which is the part that never shows up in a procurement deck and always shows up in the invoice. The scheduler note is the same story inside one device, and Your Cluster Is Interconnect-Bound, Not Compute-Bound is the same story at the fabric. Waiting is the line item nobody writes down.
THE UNCOMFORTABLE QUESTION
You can name your cost per GPU hour and your dollars per million tokens. Can you name your idle fraction? If you cannot, you are not buying compute. You are buying waiting.
Get More Articles Like This
Getting your AI agent setup right is just the start. I'm documenting every mistake, fix, and lesson learned as I build PhantomByte.
Subscribe to receive updates when we publish new content. No spam, just real lessons from the trenches.
Build Real AI Infrastructure
PhantomByte teaches you to build real AI infrastructure yourself: local AI stacks, autonomous agents, multi-agent orchestration, web scraping, and custom tools. Step-by-step PDF tutorials you download, follow, and deploy. No subscriptions. No fluff. Just skills that ship.